
Maintenance and Construction of Optical Cable Lines
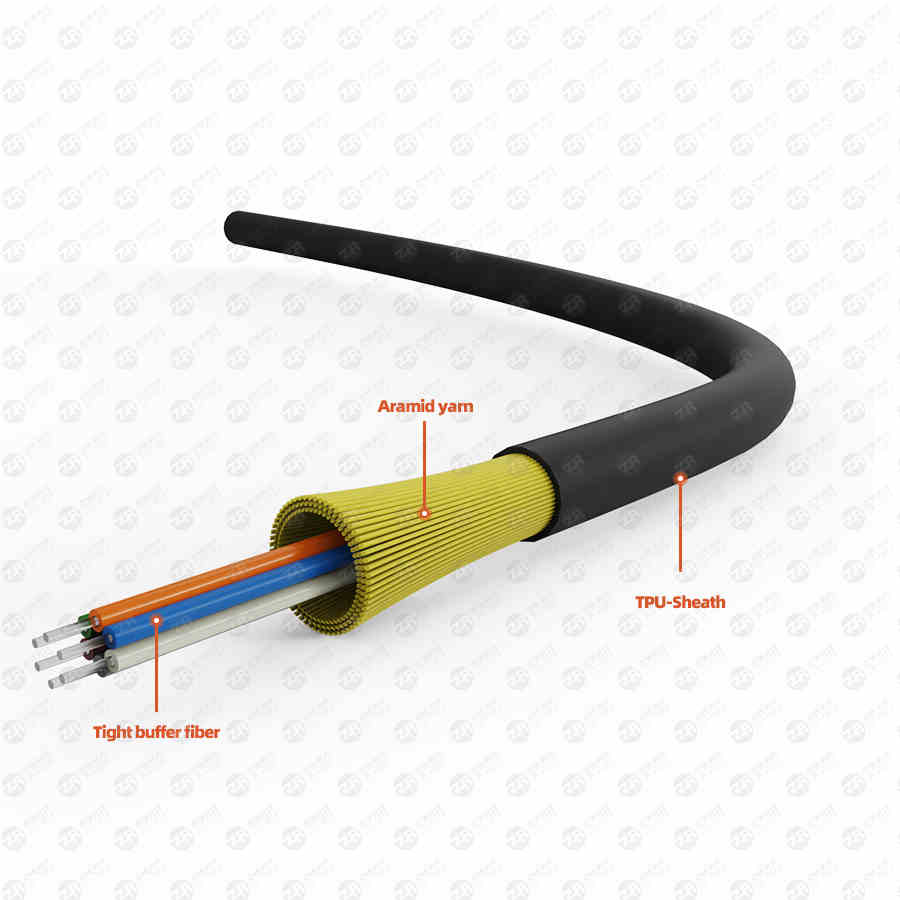
This paper introduces the causes and treatment methods of large attenuation points of optical cable lines, line maintenance and testing methods, and standardized operation procedures for construction and connection of optical cable lines. It also briefly introduces the composition and structure of the optical cable, the naming method and the standard chromatographic arrangement of the optical fiber. very powerful!
Section 1 Causes and Treatment Methods of Large Attenuation Points in Optical Cable Lines
In the construction of the optical cable line, the attenuation index of the optical cable line is an important evaluation index. Not only the average loss coefficient of the optical fiber of the optical cable line after construction, but also the optical fiber scattering curve of the optical cable line and the average loss coefficient of the optical cable line should be evaluated. The total loss and total loss must not only meet the design requirements, but also meet the requirements of the construction specifications and acceptance standards, and the optical fiber scattering curve should be relatively uniform, and there should be no large attenuation steps on the curve to ensure the optical characteristics of the optical cable line. Technical indicators Meet the requirements of construction specifications and acceptance criteria.
fiber optic line
1. Several phenomena and causes of large attenuation points of optical cables
1.1 Large attenuation point generated during laying
In the construction of optical cables, because the laying length of optical cables is generally between 2 and 3KM when directly buried, there are many obstacles to pass through. When there are many obstacles, such as: passing through protective steel pipes, turning, going up and down slopes, etc., the so-called back-buckling (dead bend) phenomenon of the optical cable will occur, which will cause serious damage to the optical cable. Once the dead bend occurs, it will inevitably appear here. At a large attenuation point, some or all of the optical fibers will be broken seriously, which is a fault phenomenon that is prone to occur in the construction of optical cables.
In addition, when laying the optical cable, the optical cable at the end of the optical cable is the most vulnerable to damage. During the connection, it often shows a large loss value at the connection point. At this time, even if the fusion is repeated many times, the connection loss value cannot be reduced. Thus forming a larger decay point.
1.2 The large attenuation point generated in the connection process
In the process of optical cable splicing, large attenuation points often occur. We generally use OTDR (Optical Time Domain Reflectometer) to monitor, that is, for each optical fiber spliced, use OTDR to test the attenuation value of the splice point. During the test, the two-way monitoring method is adopted. Due to the differences in the optical fiber manufacturing process, the two fibers cannot be completely consistent, and there is always an inconsistency in the mode field diameter. As a result, the loss value measured by the OTDR is not the connection point. The actual loss value has positive and negative values. Generally, the arithmetic mean of the two-way test values is used as the actual loss value.
During splicing, the real-time monitoring method is generally used, which can basically ensure that the splicing loss reaches the control target, but the reason for the frequent occurrence of large loss points is that when the optical fiber is contained after the splicing, some optical fibers are compressed or the bending radius is too small, which forms a big loss point.
Because the optical fiber with wavelength of 1550nm is very sensitive to micro-bending loss, once the optical fiber is compressed, a micro-bending point is generated, or when the fiber is coiled, the bending radius is too small, and the optical fiber signal also produces a large attenuation here, which is manifested in the optical fiber. On the backscattering curve, a large attenuation step is formed; in addition, a relatively easy to ignore reason is that after the optical cable splice box is assembled, when fixing the splice box and fixing the optical cable, because the optical cable is not fixed in the splice box. It is very firm, causing the optical cable to twist and deform the optical fiber bundle. Due to the compression of the optical fiber, the optical fiber attenuation value increases sharply, forming an attenuation step.
1.3 Large attenuation points caused by transportation and handling
When the optical cable is transported to the construction site, due to the harsh site environment, especially when laying the railway communication optical cable, the crane is often unable to reach the construction site. At this time, the optical cable is often loaded and unloaded manually. It is often damaged because the diameter of the optical cable reel is too small, which causes the outer optical cable to be too close to the ground. Due to the uneven soft and hard soil on the site, the optical cable reel sinks into the ground during the process of rolling the optical cable reel, causing the outer layer Optical cables are damaged by hard objects on the ground. The main reason is that some manufacturers use smaller optical cable reels to reduce production costs.
In addition, the optical cable reel is not covered with wooden boards (some are iron-frame optical cable reels, which cannot be packaged with wooden boards), but only wrapped with plastic sheeting on the outer layer of the optical cable, or after the single-reel test, the optical cable reel is not packaged. After the outer layer of the optical cable is damaged by hard objects such as stones, the optical fiber is compressed in the bundle tube, that is, an attenuation step is generated, which is reflected in the backscattering curve of the optical fiber. a larger decay point.
1.4 The large attenuation point generated in the process of end formation
In the process of terminating the optical cable, a large loss point is often generated. When the end is formed, since the splice loss monitoring is generally not carried out, and the operation is only based on experience, the probability of generating a large loss point is also greatly increased. In addition, when the accommodating tray is installed after optical fiber fusion, the bending radius of the optical fiber bundle tube near the accommodating tray is often too small or the optical fiber bundle tube is twisted and deformed, so that the optical fiber has a large attenuation point here. The attenuation point is generally relatively hidden, unlike the large attenuation point in the middle of the line, which can be directly measured with an OTDR.
2. Find, locate and process the large attenuation point of the optical cable
2.1 Generally, the location of the large attenuation point
After the optical cable connection is completed, we generally use OTDR to test the entire hop. Through the test, we can check whether the optical characteristics of the connected hops meet the requirements of construction specifications and acceptance standards, mainly from the following aspects. Assessment: Whether the total attenuation of the hop is less than the design specification (that is, whether the average attenuation coefficient is less than the design specification);
Whether the bidirectional average attenuation value of the junction joint is less than the acceptance standard and design requirements; whether the slope of the backscattering curve of the junction section is uniform and the curve is smooth, except for the small steps of the normal joint attenuation point, there should be no large attenuation on the curve steps. When using OTDR for optical hop test and human attenuation point positioning, the test parameters of the instrument should be correctly set first, such as test range, test wavelength, pulse width, refractive index and average processing time.
For the setting of the test range, generally select the appropriate range according to the length of the hop, so that the entire hop curve occupies 2/3 of the entire display screen; the test wavelength is determined according to the wavelength used by the system, and is generally used for long-distance trunk cables. The refractive index for 1310nm and 1550nm is set according to the refractive index of the fiber used by the manufacturer;
The pulse width is an important setting parameter. If the pulse width is too small, the dynamic range of the test is too small, and the entire curve cannot be tested completely, which is manifested as a large noise signal at the end of the curve, and the obtained curve quality is poor; if the pulse width is too large, the tested The larger the range, the worse the test accuracy will be. Generally, an appropriate test pulse width should be selected according to the length of the hop under test. Consider both the test distance and the test accuracy. Through the test, select a suitable pulse width. Width; the setting of the averaging time is determined according to the averaged curve quality test, so that there is no obvious burr on the end of the averaged curve.
In order to accurately determine the position of the optical fiber fault point on the line, the OTDR analysis software can be used to analyze the curve tested by the instrument. Generally, there are two cases of fault in the splice box and fault on the cable body.
2.2 Processing of large attenuation points
First, determine whether the large attenuation point is the joint position. Generally, at the joint position, all fibers have large or small attenuation steps. The curves of multiple fibers can be analyzed at the same time, and it can be seen that all the curves have sizes at the joint point. For different steps, we can test and calculate the bidirectional attenuation value of the joints at the same position of each optical fiber, make a record of the ones that are larger than the index requirements, and arrange to open the joint box for the large attenuation point of the joint position for processing.
For the large attenuation points of some optical fibers that are not at the joint position, we analyze multiple curves at the same time, and we can see that some curves have attenuation steps at this point, and some have no attenuation steps. Based on this, it can be judged that this is not a joint. The fault of the position, but the fault of the optical cable in the middle of the optical cable line.
For the fault at the joint, its location is relatively easy to locate, and for the fault at the non-joint position, it is difficult to locate. The general principle is that the fault point close to the test end can be tested at the end station, and the OTDR can be used to measure the nearest fault point. The distance of the joint point, for the fault point far from the test point, due to the long distance, the accuracy of the test is relatively reduced, and it is difficult to locate accurately, you can open it at the nearest joint box, connect to the OTDR for testing, and measure the fault point. After the distance, combined with the various residuals recorded in the original construction data, according to the conditions of the direct buried path, the approximate location of the fault point can be measured on the spot, which can generally be located within a range of more than ten meters, so that the excavation range is relatively small, saving energy The construction cost is reduced and the time for troubleshooting is shortened.
For the large loss point at the joint, we open the joint box for re-splicing processing, and use the OTDR to monitor in real time until the splice loss meets the requirements. Sometimes after multiple fusion splices, the splicing loss fails to meet the requirements. At this time, it is necessary to check whether the optical fiber is compressed due to the deformation of the optical fiber bundle, whether the bending radius of the optical fiber is too small when the fiber is coiled, and whether the optical fiber is compressed.
After these inspections, if the requirements cannot be met, it is necessary to consider whether there is a problem with the optical cables before and after the splice box. Because the optical cable at the end is more likely to be damaged during construction, it is necessary to cut off another section of the optical cable and re-splicing all the optical fibers. In order to avoid such problems, we can carefully check the remaining optical cables at the joints before connecting, and cut off more parts of the optical cables at the suspected end to avoid such problems.
For the treatment of the large attenuation point of the optical cable in the middle of the line, after finding the fault point, it can be found that such a fault or the optical cable has been buckled, or the optical cable has been damaged, such as being damaged by hard objects such as stones, which makes the optical cable appear. Deformation phenomena such as indentation and flattening, the deformation of the optical fiber bundle tube causes the optical fiber to be compressed, resulting in a large attenuation point, or other external force factors cause the optical cable to be damaged. When processing, this section of optical cable can be cut off and spliced again. Generally, after this processing, the large attenuation point basically disappears. For the fault point of the back buckle found during construction, the fault point should be properly reserved for processing.
For serious damage, when adding a splice box, the outer sheath of the optical cable can be peeled off, the deformed bundle tube can be processed, and if necessary, the optical fiber in the damaged bundle tube can be connected. The test point should contact the on-site welding personnel to conduct a test after the welding is completed, a test after the optical fiber is left, and a test after the splice box is tightened and sealed. After the test point test confirms that the decay point fault disappears, the site personnel evacuate.
Section 2 How to use the line maintenance test instrument
Optical fiber and optical cable line testing, starting from the maintenance of optical cable lines, considering the needs and possible test items and means, and determining the essential test items based on the current reality. It includes: single-disk optical cable test, optical cable junction test, optical cable junction fault repair test, etc.
In order to better use the instrument and analyze the data correctly, this section introduces the optical time domain reflectometer (OTDR), a key instrument that is often used, in detail, and discusses the management and analysis of the measured data. All of this is the key to the maintenance of optical cable lines
1. Manual setting of measurement parameters:
1.1 wavelength selection (λ):
Because different wavelengths correspond to different light characteristics (including attenuation, microbend, etc.), the test wavelength generally follows the principle corresponding to the system transmission communication wavelength, that is, the system opens 1550 wavelengths, and the test wavelength is 1550nm. (The OTDR test wavelength options only have two modes: 1550 and 1310. Generally, we use 1550 for testing, because the 1550 wavelength is more sensitive to the change of fiber attenuation than 1310.)
1.2 Pulse width:
The longer the pulse width, the larger the dynamic measurement range and the longer the measurement distance, but the larger the blind spot in the OTDR curve waveform; the smaller the pulse width, the smaller the measurement range but can reduce the blind spot. At the same time, the measured data is also more comprehensive. The larger the test distance, the larger the pulse width to be selected. Usually, the pulse width within 10 kilometers can be set to 10ns or 30ns for effective data acquisition. If the quality of the fiber is seriously deteriorated, a larger pulse width should be adjusted to Implement data measurement.
1.3 Measuring range
The OTDR measurement range refers to the maximum distance that the OTDR obtains data sampling. The selection of this parameter determines the sampling resolution. The optimal measurement range is between 1.5 and 2 times the length of the fiber to be measured.
1.4 Average time:
Since the backscattered light signal is extremely weak, a statistical averaging method is generally used to improve the signal-to-noise ratio. The longer the averaging time, the higher the signal-to-noise ratio. For example, a 3min acquisition will increase the dynamics by 0.8dB over a 1min acquisition. But the acquisition time of more than 10min did not improve the signal-to-noise ratio much. Generally, the average time does not exceed 3min.
1.5 Optical fiber parameters:
The settings of the fiber parameters include the settings of the refractive index n, the backscattering coefficient n and the backscattering coefficient η. The refractive index parameter is related to distance measurements, while the backscatter coefficient affects reflection and return loss measurements. These two parameters are usually given by the fiber optic manufacturer. The general national unified standard for refractive index 1310SM is 1.46500, 1360-1510SM is 1.46500, 1550SM is 1.47180, 1625SM is 1.46500 The general national standard for dispersion coefficient 1310SM is -79.0, 1360-1510SM is -81.0, 1550SM is -81.0, 1625SM is - 81.0
After the parameters are set, the OTDR can send optical pulses and receive the light scattered and reflected by the fiber link, sample the output of the photodetector, and obtain the OTDR curve, and analyze the curve to understand the fiber quality.
2. Experience and skills Simple judgment of fiber quality:
2.1 Simple judgment of fiber quality:
Under normal circumstances, the slope of the main body of the light curve (single or several cables) tested by OTDR is basically the same. If the slope of a certain section is large, it indicates that the attenuation of this section is large; If it is bent or curved, it indicates that the quality of the fiber is seriously deteriorated and does not meet the communication requirements.
2.2 Wavelength selection and one-way and two-way testing:
The 1550 wavelength test distance is farther, the 1550 nm fiber is more sensitive to bending than the 1310 nm fiber, the 1550 nm has less attenuation per unit length than the 1310 nm, and the 1310 nm test has a higher loss of fusion or connector than the 1550 nm. In the actual optical cable maintenance work, both wavelengths are generally tested and compared. For positive gain phenomenon and over-distance lines, two-way test analysis and calculation must be carried out in order to obtain a good test conclusion.
2.3 Connector cleaning:
Before the optical fiber joint is connected to the OTDR, it must be carefully cleaned, including the output joint of the OTDR and the joint under test. Otherwise, the insertion loss will be too large, the measurement will be unreliable, the curve will be noisy and even the measurement will not be carried out, and it may damage the OTDR. Avoid cleaning agents or index matching fluids other than alcohol, as they can dissolve the adhesive within the fiber optic connector.
2.4 Correction of refractive index and scattering coefficient:
As far as fiber length measurement is concerned, every 0.01 deviation of the refractive index will cause an error of as much as 7 m/km. For longer ray segments, the refractive index value provided by the fiber optic cable manufacturer should be used.
2.5 Identification and processing of ghost images:
Spikes on the OTDR curve are sometimes echoes caused by strong reflections close to the incident end. Such spikes are called ghosting. Identifying ghosts: No obvious loss is caused at the ghosts on the curve; the distance between the ghosts and the beginning along the curve is a multiple of the distance between the strong reflection event and the beginning, which is symmetrical. Eliminate ghosting: choose short pulse widths, add attenuation in strongly reflective front ends such as OTDR outputs. If the event causing the ghosting is at the end of the fiber, a "small bend" can be made to attenuate the light reflected back to the beginning.
2.6 Processing of positive gain phenomenon:
A positive gain phenomenon may occur on the OTDR curve. The positive gain is due to the fact that the fiber after the splice produces more backscatter than the fiber before the splice. In fact, the fiber is splice loss at this splice point. It often occurs in the splicing process of fibers with different mode field diameters or different backscattering coefficients. Therefore, it is necessary to measure in two directions and average the results as the splicing loss. In the actual maintenance of optical cables, the simple principle of ≤0.08dB can also be adopted.
2.7 Use of additional optical fibers:
The additional fiber is a length of 300-2000m fiber used to connect the OTDR and the fiber to be measured. Its main functions are: front-end blind spot processing and terminal connector insertion measurement. Generally speaking, the dead zone caused by the connector between the OTDR and the fiber under test is the largest. In the actual measurement of the fiber, a transition fiber is added between the OTDR and the fiber to be tested, so that the blind area of the front end falls within the transition fiber, and the beginning of the fiber to be tested falls in the linear stability region of the OTDR curve. The insertion loss of the connector at the beginning of the optical fiber system can be measured by adding a transition fiber to the OTDR. If you want to measure the insertion loss of the connector at the head and tail ends, you can add a transition fiber at each end.
Three, the main factors of test error
3.1 Set the error caused by the refractive index deviation of the instrument.
Different types and manufacturers of optical fibers have different refractive indices. When using the OTDR to test the length of the optical fiber, the instrument parameters must be set first, and the setting of the refractive index is one of them. When the refractive indices of several sections of optical cables are different, the method of segment setting can be used to reduce the test error caused by the setting error of the refractive index.
3.2 Improper selection of measuring range
When the OTDR meter test distance resolution is 1 meter, it means that the graph can only be realized when the horizontal scale is 25 meters/div. The design of the meter is that every 25 steps the cursor moves is a full grid. In this case, every time the cursor moves one step, it means a distance of 1 meter, so the readout resolution is 1 meter. If the horizontal scale is 2 km/div, the distance will be offset by 80 meters for each step of the cursor. It can be seen that the larger the range selected during the test, the greater the deviation of the test results.
3.3 Improper selection of pulse width Under the condition of the same pulse amplitude, the larger the pulse width is, the larger the pulse energy is. At this time, the dynamic range of the OTDR is also larger, and the corresponding blind area is also larger.
3.4 Improper selection of averaging time The OTDR test curve is to sample the reflected signal after each output pulse, and average multiple samples to eliminate some random events. The longer the averaging time, the closer the noise level is to the minimum value. The greater the dynamic range. The longer the averaging time, the higher the test accuracy, but the accuracy no longer improves when it reaches a certain level. In order to improve the test speed and shorten the overall test time, the general test time can be selected within 0.5~3 minutes.
3.5 Improper placement of the cursor position Optical fiber flexible connectors, mechanical joints and breaks in the fiber will cause loss and reflection, and the cracked end face of the fiber end will produce various Fresnel reflection peaks or no Fresnel reflection due to the irregularity of the end face. reflection. If the cursor setting is not accurate enough, certain errors will also occur.
4. The difference between the inferred attenuation displayed by the fusion splicer and the actual OTDR test
From the current situation of the fusion splicer, the data displayed by the fusion splicer can be used to roughly estimate the loss of the optical fiber splice point, but it cannot be accurate to the order of magnitude of the optical fiber splice loss index required by our country. The current fusion splicer splicing is performed by adjusting the misalignment of the X-axis and Y-axis directions of the optical fiber, and splicing is performed when the misalignment of the axis is minimal. With the power detection method, it is impossible to know the exact value of the joint loss on site.
However, in the whole process of adjusting the axis and splicing and splicing, the information of the state of the spliced fiber core detected by the camera is sent to the special program of the fusion splicer, and the loss value after the splicing can be calculated. However, it can only show the degree of alignment of the fiber axis, and does not include the loss affected by the inherent characteristics of the fiber itself. The test method of OTDR is the backscattering method, which includes the loss of reflection caused by different fiber parameters.
Comparing the above two test principles, there is a big difference between the two. It has been proved by practice that the data consistency measured by the two methods is also poor. Through the connection test of the trunk line project in recent years, it is found that in many cases, the loss of the fusion splicer is very small (less than 0.05dB) or even zero, but the OTDR test is greater than 0.08dB, and no corresponding rule was found. The welding attenuation standard of the on-site splice joint shall be based on the OTDR test value.